How Many kWh Per Day Is Normal in the US?
ZacharyWilliamHome electricity use guide · Updated May 12, 2026
Most U.S. homes use about 28 to 29 kWh per day, based on the latest 2024 residential electricity data from the U.S. Energy Information Administration. That national number is useful, but it should not be treated as a “one-size-fits-all” target. A small apartment in California, New York, or Hawaii may use far less. A single-family home in Louisiana, Mississippi, Alabama, Tennessee, Florida, or Texas may use far more, especially during cooling season.
Quick Answer
Normal U.S. home electricity use is roughly 28–29 kWh per day. In 2024, the average residential electric customer used 863 kWh per month, which equals about 28.4 kWh per day when averaged across the full year.
- Low daily use: under 15 kWh/day, common for small apartments, efficient homes, or homes using gas for heat, water heating, cooking, and drying.
- Typical daily use: about 20–40 kWh/day, common for many U.S. single-family homes.
- High daily use: 40+ kWh/day, common in larger homes, hot climates, all-electric homes, homes with pools, or homes charging an EV.
The best way to judge your own home is simple: check the kWh line on your electric bill and divide it by the number of billing days.

What Is a Normal kWh Per Day for a U.S. Home?
A normal U.S. household number is about 28–29 kWh per day. This comes from the 2024 EIA residential average of 863 kWh per month. Annualized, that is about 10,356 kWh per year.
For ordinary homeowners, the important point is not whether your home matches the national average exactly. The useful question is: does your daily kWh make sense for your home size, state, season, and appliance mix?
| Daily kWh Range | What It Usually Means | Common Home Profile | What to Check First |
|---|---|---|---|
| Under 10 kWh/day | Very low electricity use | Small apartment, mild climate, gas heat/water heater, little A/C use | Make sure solar credits or net metering are not hiding actual use |
| 10–20 kWh/day | Low to moderate | Apartment, townhouse, efficient small home, or mild-climate household | Look at seasonal swings and heating fuel type |
| 20–40 kWh/day | Normal for many U.S. homes | Typical single-family home with regular HVAC, laundry, lighting, electronics, and refrigerator use | Compare summer and winter bills |
| 40–60 kWh/day | High but common in some homes | Hot-climate home, large home, all-electric home, pool pump, electric water heater, or frequent EV charging | Check HVAC runtime, water heater, pool pump schedule, and EV charging |
| 60+ kWh/day | Very high | Large all-electric home, poor insulation, heavy A/C or heat use, multiple refrigerators/freezers, EV, pool/spa | Use hourly smart-meter data or a plug meter to find the largest loads |
Normal kWh Per Day by Home Type
Two homes in the same city can have very different daily kWh numbers. A gas-heated apartment may use only a fraction of what a large all-electric house uses. Use the table below as a practical starting point before comparing your usage with your state average.
| Home or Situation | Typical Daily kWh | Why It Lands There | When It May Be Higher |
|---|---|---|---|
| Studio or one-bedroom apartment | 6–15 kWh/day | Smaller space, fewer appliances, often shared building systems | Window A/C, electric heat, old refrigerator, always-on electronics |
| Two-bedroom apartment or townhouse | 12–25 kWh/day | More lighting, electronics, laundry, and cooking | Electric water heater, home office, high summer cooling |
| Average single-family home | 20–40 kWh/day | HVAC, water heating, refrigerator, laundry, kitchen appliances, electronics | Hot or cold weather, poor insulation, all-electric appliances |
| Large all-electric home | 40–80+ kWh/day | Electric heat, electric water heater, larger HVAC load, more rooms | Heat strips, pool/spa, multiple freezers, EV charging |
| Home with EV charging | Add roughly 6–20+ kWh/day | Daily mileage becomes part of the home electric bill | Long commute, large EV, cold weather, charging losses |
Average kWh Per Day by State
The table below uses EIA’s 2024 residential average monthly consumption by state. The daily number is calculated from the monthly figure across a full year, so it is a year-round average—not a summer peak or winter peak.
On mobile, swipe the table sideways to see all columns.
| State | Avg. Monthly kWh | Approx. Daily kWh | Approx. Annual kWh | Avg. Price (¢/kWh) | Avg. Monthly Bill | Quick Read | Source |
|---|---|---|---|---|---|---|---|
| U.S. Average | 863 | 28.4 | 10,356 | 16.48 | $142.26 | National benchmark | EIA 2024 Table 5A |
| Connecticut | 695 | 22.8 | 8,340 | 28.75 | $199.66 | High rates; moderate usage | EIA 2024 Table 5A |
| Maine | 550 | 18.1 | 6,600 | 24.29 | $133.60 | Lower usage; heating often non-electric | EIA 2024 Table 5A |
| Massachusetts | 570 | 18.7 | 6,840 | 29.35 | $167.20 | Lower usage, high price | EIA 2024 Table 5A |
| New Hampshire | 619 | 20.4 | 7,428 | 23.40 | $144.87 | Moderate Northeast use | EIA 2024 Table 5A |
| Rhode Island | 567 | 18.6 | 6,804 | 28.65 | $162.40 | Lower use, high price | EIA 2024 Table 5A |
| Vermont | 574 | 18.9 | 6,888 | 21.90 | $125.66 | Lower use; efficiency and fuel mix matter | EIA 2024 Table 5A |
| New Jersey | 662 | 21.8 | 7,944 | 19.34 | $128.13 | Below national average | EIA 2024 Table 5A |
| New York | 571 | 18.8 | 6,852 | 24.43 | $139.53 | Apartment-heavy; gas heat common | EIA 2024 Table 5A |
| Pennsylvania | 817 | 26.9 | 9,804 | 17.77 | $145.17 | Near national average | EIA 2024 Table 5A |
| Illinois | 693 | 22.8 | 8,316 | 15.87 | $109.99 | Below national average | EIA 2024 Table 5A |
| Indiana | 901 | 29.6 | 10,812 | 14.77 | $133.06 | Slightly above national average | EIA 2024 Table 5A |
| Michigan | 618 | 20.3 | 7,416 | 19.30 | $119.31 | Below national average | EIA 2024 Table 5A |
| Ohio | 846 | 27.8 | 10,152 | 15.99 | $135.16 | Near national average | EIA 2024 Table 5A |
| Wisconsin | 645 | 21.2 | 7,740 | 17.18 | $110.87 | Below national average | EIA 2024 Table 5A |
| Iowa | 832 | 27.4 | 9,984 | 13.40 | $111.54 | Near national average | EIA 2024 Table 5A |
| Kansas | 876 | 28.8 | 10,512 | 14.15 | $123.90 | Near national average | EIA 2024 Table 5A |
| Minnesota | 712 | 23.4 | 8,544 | 15.45 | $110.06 | Below national average | EIA 2024 Table 5A |
| Missouri | 1,001 | 32.9 | 12,012 | 12.91 | $129.18 | Above average; seasonal swings | EIA 2024 Table 5A |
| Nebraska | 956 | 31.4 | 11,472 | 11.53 | $110.28 | Above national average | EIA 2024 Table 5A |
| North Dakota | 1,029 | 33.8 | 12,348 | 11.51 | $118.38 | High usage, lower price | EIA 2024 Table 5A |
| South Dakota | 994 | 32.7 | 11,928 | 12.86 | $127.81 | Above national average | EIA 2024 Table 5A |
| Delaware | 911 | 30.0 | 10,932 | 16.57 | $150.87 | Above national average | EIA 2024 Table 5A |
| District of Columbia | 639 | 21.0 | 7,668 | 17.71 | $113.23 | Below average; urban housing | EIA 2024 Table 5A |
| Florida | 1,104 | 36.3 | 13,248 | 14.14 | $156.09 | High cooling load | EIA 2024 Table 5A |
| Georgia | 1,074 | 35.3 | 12,888 | 14.08 | $151.25 | High cooling load | EIA 2024 Table 5A |
| Maryland | 929 | 30.5 | 11,148 | 17.86 | $165.87 | Above national average | EIA 2024 Table 5A |
| North Carolina | 1,015 | 33.4 | 12,180 | 14.13 | $143.50 | High cooling load | EIA 2024 Table 5A |
| South Carolina | 1,050 | 34.5 | 12,600 | 14.23 | $149.51 | High cooling load | EIA 2024 Table 5A |
| Virginia | 1,032 | 33.9 | 12,384 | 14.41 | $148.77 | Above national average | EIA 2024 Table 5A |
| West Virginia | 1,027 | 33.8 | 12,324 | 15.07 | $154.76 | Above national average | EIA 2024 Table 5A |
| Alabama | 1,143 | 37.6 | 13,716 | 15.18 | $173.50 | Very high cooling/electric load | EIA 2024 Table 5A |
| Kentucky | 1,047 | 34.4 | 12,564 | 12.79 | $133.81 | High usage, lower price | EIA 2024 Table 5A |
| Mississippi | 1,156 | 38.0 | 13,872 | 13.39 | $154.83 | Very high cooling load | EIA 2024 Table 5A |
| Tennessee | 1,154 | 37.9 | 13,848 | 12.42 | $143.32 | Very high usage | EIA 2024 Table 5A |
| Arkansas | 1,048 | 34.5 | 12,576 | 12.32 | $129.13 | High usage, lower price | EIA 2024 Table 5A |
| Louisiana | 1,202 | 39.5 | 14,424 | 11.73 | $140.96 | Highest usage in this table | EIA 2024 Table 5A |
| Oklahoma | 1,079 | 35.5 | 12,948 | 12.24 | $132.05 | High cooling load | EIA 2024 Table 5A |
| Texas | 1,096 | 36.0 | 13,152 | 14.94 | $163.72 | High cooling load | EIA 2024 Table 5A |
| Arizona | 1,075 | 35.3 | 12,900 | 14.91 | $160.24 | High cooling load | EIA 2024 Table 5A |
| Colorado | 674 | 22.2 | 8,088 | 14.92 | $100.57 | Below average | EIA 2024 Table 5A |
| Idaho | 944 | 31.0 | 11,328 | 11.52 | $108.73 | Above average, low price | EIA 2024 Table 5A |
| Montana | 852 | 28.0 | 10,224 | 12.66 | $107.91 | Near national average | EIA 2024 Table 5A |
| Nevada | 930 | 30.6 | 11,160 | 15.00 | $139.39 | Above average | EIA 2024 Table 5A |
| New Mexico | 654 | 21.5 | 7,848 | 14.20 | $92.88 | Below average | EIA 2024 Table 5A |
| Utah | 774 | 25.4 | 9,288 | 12.22 | $94.57 | Below national average | EIA 2024 Table 5A |
| Wyoming | 863 | 28.4 | 10,356 | 12.47 | $107.65 | Matches U.S. average consumption | EIA 2024 Table 5A |
| California | 503 | 16.5 | 6,036 | 31.97 | $160.86 | Lowest kWh among contiguous states; high price | EIA 2024 Table 5A |
| Oregon | 882 | 29.0 | 10,584 | 14.70 | $129.62 | Near national average | EIA 2024 Table 5A |
| Washington | 955 | 31.4 | 11,460 | 11.90 | $113.68 | Above average, low price | EIA 2024 Table 5A |
| Alaska | 578 | 19.0 | 6,936 | 24.82 | $143.54 | Lower use, high price | EIA 2024 Table 5A |
| Hawaii | 495 | 16.3 | 5,940 | 42.86 | $212.12 | Lowest kWh; highest price | EIA 2024 Table 5A |
Why Your Daily kWh May Be Higher or Lower
If your number is far from the state average, it does not automatically mean something is wrong. Daily kWh is shaped by a few big factors.
1. Climate and HVAC
Air conditioning, space heating, and water heating are three of the largest electricity uses in U.S. homes. Hot Southern states often show higher average kWh because A/C runs longer. Cold-climate homes can also spike in winter when they use electric heat, heat strips, or space heaters.
2. Fuel Mix Inside the Home
A home with gas heat, gas water heating, and a gas range may show lower electric kWh than a similar home where everything is electric. That does not always mean the first home uses less total energy; it means some of its energy use appears on the gas bill instead of the electric bill.
3. Home Size, Insulation, and Windows
A larger home usually needs more energy to heat, cool, dehumidify, and light. Poor insulation, leaky ducts, single-pane windows, and air gaps can turn HVAC into a much bigger daily load.
4. Always-On Loads
Wi-Fi routers, security cameras, smart-home hubs, standby electronics, extra refrigerators, freezers, aquarium pumps, and pool pumps can run quietly in the background every day. A small load becomes a big monthly number when it runs 24/7.
5. Solar Can Make Bills Look Lower Than Actual Use
If your home has rooftop solar, your electric bill may show lower grid purchases than your true household consumption. Net metering can reduce what you buy from the grid, while your home may still be using more electricity behind the meter.
How to Calculate Your Own Daily kWh
Your bill is more accurate than any national average. Look for the line that says “kWh used,” “total kWh,” or “energy usage.” Then divide by the number of billing days.
Simple bill formula
Daily kWh = total kWh used ÷ billing days
Example: if your bill shows 930 kWh over 31 days, your daily average is about 30 kWh/day.
| Bill Shows | Billing Days | Daily Average | How to Read It |
|---|---|---|---|
| 450 kWh | 30 days | 15 kWh/day | Low for a single-family home; normal for some apartments or efficient homes |
| 900 kWh | 30 days | 30 kWh/day | Close to the national average |
| 1,350 kWh | 30 days | 45 kWh/day | High, but common with A/C, electric water heating, large homes, or EV charging |
| 2,100 kWh | 30 days | 70 kWh/day | Very high; check HVAC, heat strips, pool/spa, EV charging, and always-on loads |
For the clearest picture, compare at least three bills: one mild-weather month, one summer month, and one winter month. If the mild month is high, look for always-on loads. If only summer or winter is high, start with HVAC.
Appliance Examples: Where the kWh Goes
Daily kWh is just watts over time. A device that uses 1,000 watts for one hour uses 1 kWh. A smaller 100-watt load running all day uses 2.4 kWh. That is why “small” always-on devices can matter.
| Device or Load | Typical Power Range | Example Daily Use | Approx. Daily kWh | Why It Matters |
|---|---|---|---|---|
| Wi-Fi router / modem | 10–20W | 24 hours | 0.24–0.48 kWh | Small but always on |
| Laptop | 45–100W | 8 hours | 0.36–0.80 kWh | More important for work-from-home households |
| Refrigerator | 60–150W average varies by cycling | 24 hours | 1–3 kWh | Runs every day; age and door openings matter |
| Window A/C | 500–1,500W | 6 hours | 3–9 kWh | Can dominate summer bills |
| Central A/C | 2,000–5,000W while running | 4–10 runtime hours | 8–50 kWh | Often the biggest summer load |
| Electric water heater | 3,000–4,500W while heating | 1–3 runtime hours | 3–13.5 kWh | Usage depends heavily on showers and laundry |
| Electric dryer | 3,000–5,000W | 1 load | 2–5 kWh | Several loads per week can add up quickly |
| EV charging | Varies by charger and vehicle | Daily commute | 6–20+ kWh | Can shift a normal home into high-use territory |
Backup Power Sizing: Do You Need to Cover the Whole 29 kWh?
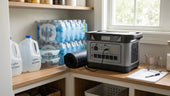
No. For power outages, most homeowners do not try to back up the entire daily household average. Running central A/C, electric heat, electric water heaters, ovens, dryers, and EV charging requires a much larger system than a portable power station. A more practical plan is to back up the loads that matter most: refrigerator, Wi-Fi, phones, lights, laptop, fan, CPAP, and small medical or communication devices.
| Outage Goal | Typical Critical Load | Daily Energy Target | Best Fit |
|---|---|---|---|
| Phones, lights, laptop, router | Low, mostly electronics | 0.5–2 kWh/day | Small to mid-size portable power station |
| Essentials plus refrigerator | Electronics + fridge cycling | 2–5 kWh/day | Larger portable power station, solar recharging helpful |
| Longer emergency comfort | Fridge, Wi-Fi, lights, fans, CPAP, device charging | 3–8 kWh/day | Larger unit, solar panel bundle, or multiple recharges |
| Whole-home style backup | HVAC, water heater, kitchen, pumps, large appliances | 10–40+ kWh/day | Whole-home battery, generator, or professionally designed system |
UDPOWER Product Picks for Realistic Backup Planning
The models below are not meant to replace a full home electrical system. They are better used for targeted essentials during outages, camping, RV trips, work-from-home backup, CPAP backup, and solar-ready emergency charging.

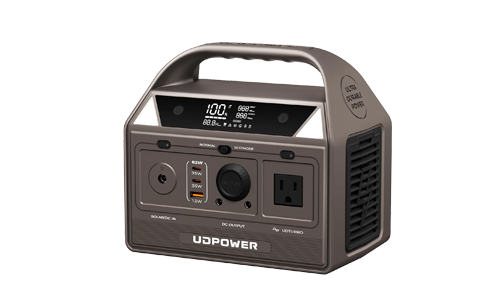
UDPOWER C400 — Compact Backup for Personal Essentials
The C400 is a good fit when the goal is to keep personal electronics, laptop work, lights, phones, camera gear, and a router running instead of powering large household appliances.
- Capacity: 256Wh
- Output: 400W AC, with UDTURBO surge support up to 800W
- Battery: LiFePO4, 4,000+ cycles
- Charging: 165W Hyper Charging with DC adapter + USB-C input
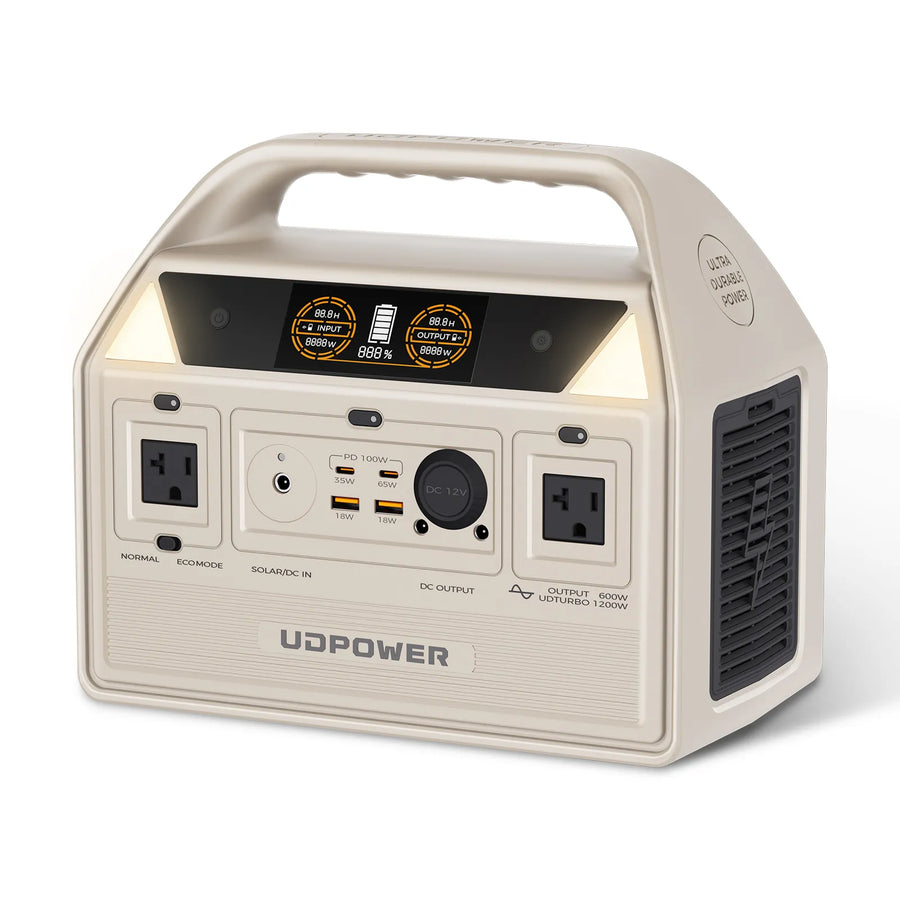
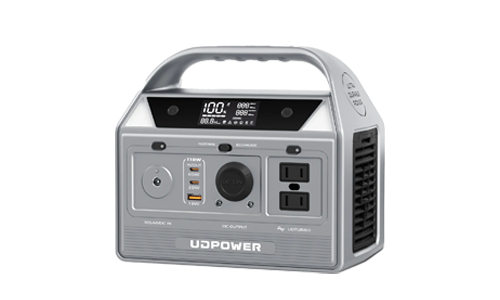
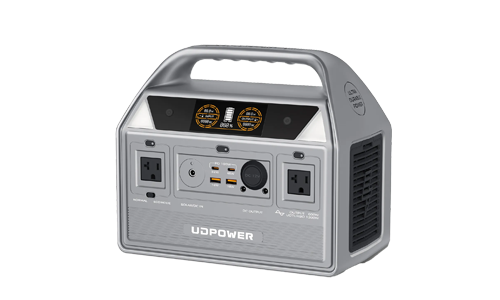
UDPOWER C600 — Light Home Essentials and Short Appliance Runs
The C600 is a practical step up for households that want more room for laptops, lighting, small fans, phones, camera batteries, and short mini-fridge or small-appliance use.
- Capacity: 596Wh
- Output: 600W rated output, 1200W peak
- Battery: LiFePO4, 4,000+ cycles
- Ports: AC outlets, USB-C, USB-A, and 12V car outlet
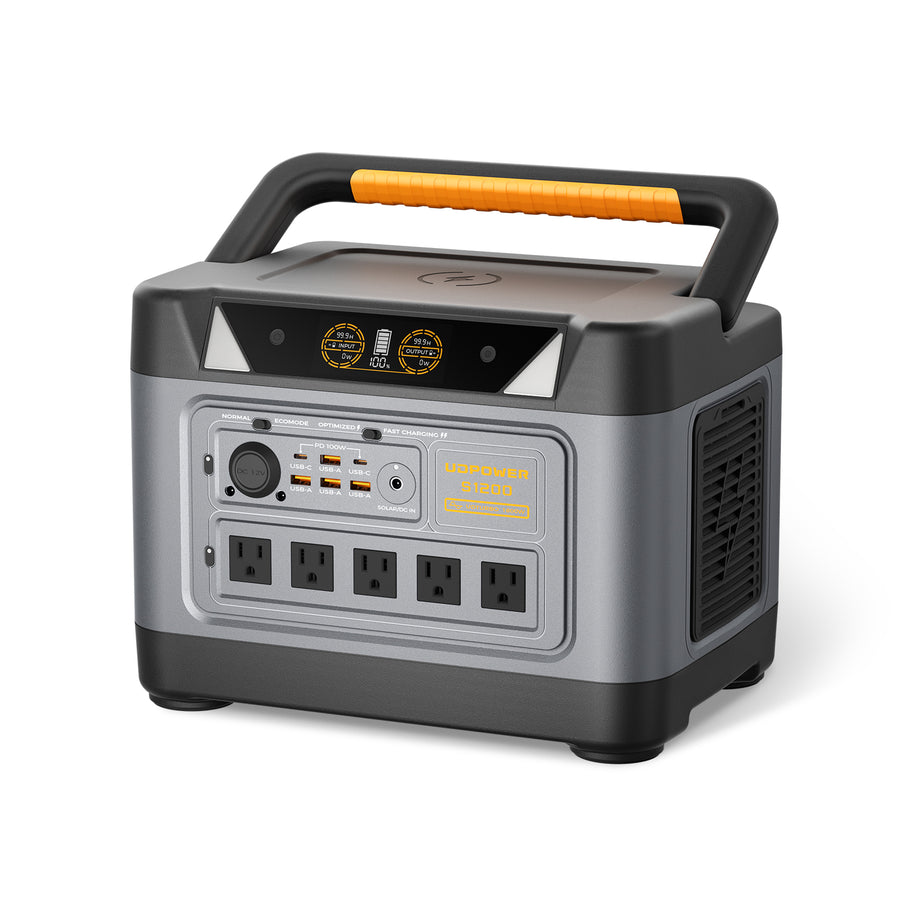
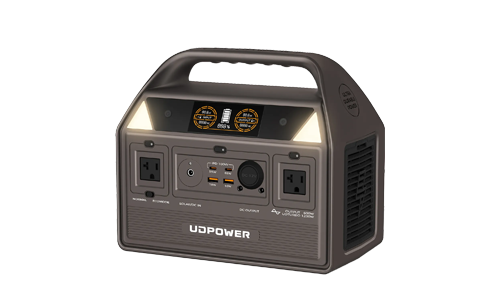
UDPOWER S1200 — Best Balanced Pick for Home Essentials
The S1200 is the better match for refrigerator support, CPAP backup, Wi-Fi, lights, fans, laptops, and device charging during short outages. It also offers UPSPRIME technology for fast switchover on compatible setups.
- Capacity: 1,190Wh
- Output: 1,200W rated pure sine wave output, UDTURBO up to 1,800W
- UPS: <10 ms UPSPRIME switchover
- Noise: <25dB quiet operation
- Battery: LiFePO4, 4,000+ cycles
- Fridge example: about 10–15 hours for a standard refrigerator, depending on cycling and efficiency
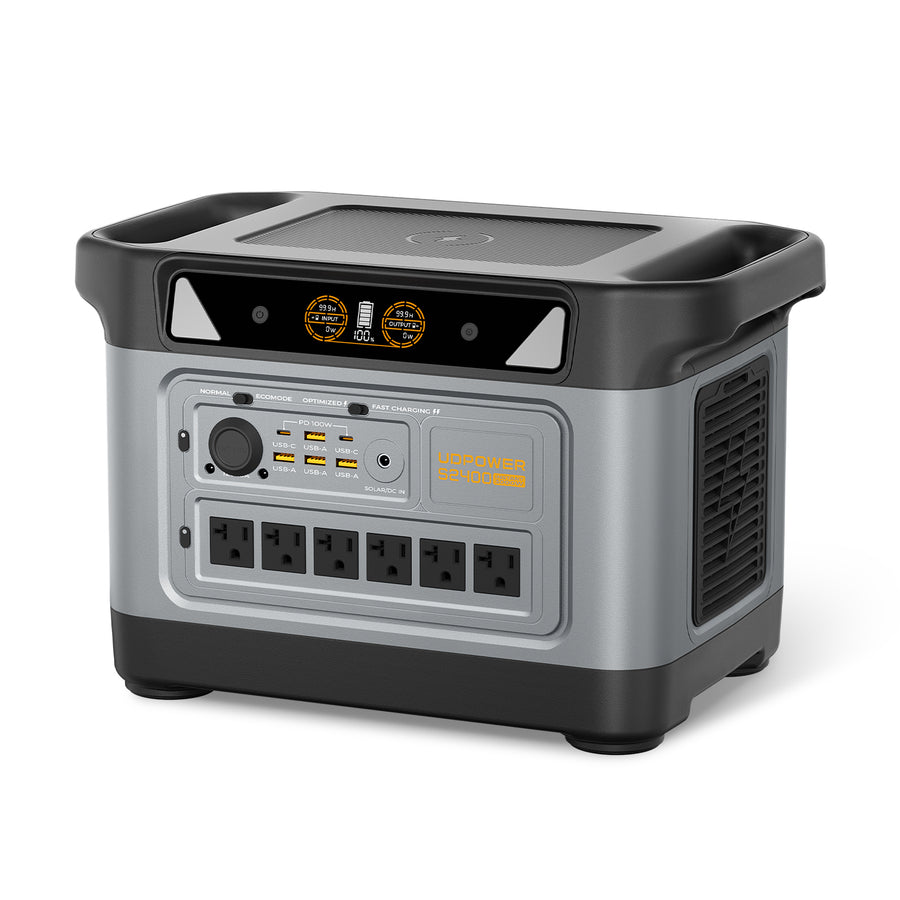
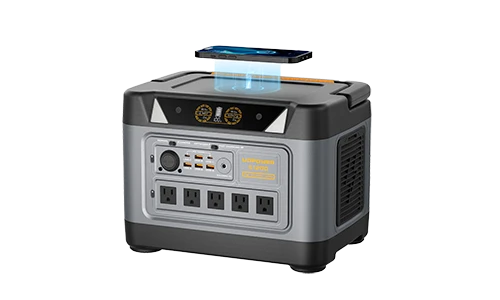
UDPOWER S2400 — More Capacity for Longer Essential Backup
The S2400 is a stronger match when you want longer refrigerator runtime, more AC outlets, higher output headroom, and more flexibility during home outages or off-grid use.
- Capacity: 2,083Wh
- Output: 2,400W pure sine wave AC output, surge support up to 3,000W
- UPS: UPSPRIME switchover time ≤10ms
- Solar input: 12–50V, 10A max, up to 400W solar charging
- Fridge example: about 18–30 hours for a standard refrigerator, depending on real appliance behavior
Simple Backup Sizing Rule
List the devices you truly need during an outage, estimate watts and hours, then add a buffer for inverter losses and real-world behavior. For example, a router, LED lights, phones, laptop, fan, and a cycling refrigerator may be a realistic portable-power target. Central A/C, electric ovens, electric dryers, and whole-home heating are not realistic targets for most portable units.
Compare UDPOWER ModelsHow to Lower Daily kWh Without Guessing
The fastest savings usually come from the biggest loads, not from unplugging one phone charger. Use your bill and habits to work in this order.
- Start with HVAC. Replace filters, seal obvious air leaks, check thermostat schedules, and make sure vents are not blocked.
- Check water heating. Long showers, hot-water laundry, and older electric tanks can add several kWh per day.
- Look for 24/7 loads. Routers, cameras, old freezers, garage refrigerators, aquarium pumps, and pool pumps can run quietly every day.
- Use smart-meter data. If your utility shows hourly usage, compare 3 a.m. usage with evening usage. High overnight consumption often points to always-on loads.
- Separate seasonal from year-round problems. A high July bill usually points to cooling. A high January bill may point to electric heat, heat strips, or space heaters. A high mild-weather bill points to base loads.
- Do not judge solar homes by the bill alone. If you have rooftop solar, compare grid purchases, solar production, and total home consumption when possible.
Need a Practical Backup Setup?
Use your daily kWh number to understand your home, then size backup power around the essentials you truly need during an outage. For most homes, that means refrigerator, Wi-Fi, phone charging, laptop, lights, fan, and CPAP—not the entire 28–29 kWh daily household average.
View Portable Power Stations Get a Model ComparisonFAQs
Is 30 kWh per day normal?
Yes. About 30 kWh/day is close to the U.S. average. It may be very normal for a single-family home, especially in a state with heavy cooling or electric heating. For a small apartment, 30 kWh/day may be high.
Is 50 kWh per day a lot?
It is above the national average, but it is not unusual for large homes, all-electric homes, hot-climate homes, homes with pools, or homes charging an EV. If your home uses 50 kWh/day in mild weather, check always-on loads and water heating.
Which states use the most electricity per household?
Based on the 2024 EIA residential monthly consumption table, Louisiana, Mississippi, Tennessee, Alabama, Florida, Texas, Oklahoma, and Arizona are among the higher-use states. Heavy cooling demand is a major reason.
Why is California’s kWh use low but the bill still high?
California’s average residential monthly kWh is low compared with many states, but its average electricity price per kWh is high. That means a household can use fewer kWh and still have a relatively high monthly bill.
How many kWh per day does an apartment use?
Many apartments fall around 6–25 kWh/day depending on size, climate, A/C use, electric heat, water heating, and how many people live there. A small apartment with gas heat may be near the lower end.
How many kWh per day does a house with an EV use?
An EV can add roughly 6–20+ kWh/day depending on daily mileage, vehicle efficiency, weather, and charging losses. That can push an otherwise average home into a high-use category.
Can a portable power station back up a normal 29 kWh day?
Not by itself for whole-home use. A portable power station is better for critical loads such as a refrigerator, router, lights, phones, laptop, fan, or CPAP. Whole-home 29 kWh/day backup usually requires a larger battery system, generator, or professionally designed setup.
What is the easiest way to find my real daily kWh?
Read your electric bill. Divide total kWh by the number of billing days. Then compare mild-weather, summer, and winter bills to see whether your main issue is base load, cooling, or heating.
Sources
- U.S. Energy Information Administration — 2024 Average Monthly Bill, Residential, Table 5A
- U.S. Energy Information Administration — Electricity use in homes
- U.S. Energy Information Administration — How much electricity does an American home use?
- U.S. Department of Energy — Reducing electricity use and costs